Inner Planets Appear to Bore Hole in Short Period (Jupiter Family) Comets
Formation
-
Anthony Zuppero, Idaho National Engineering Laboratory (NeoKismet L.L.C.,
formerly INEEL)
-
Patrick G. Whitman, University of Southwestern Louisiana (deceased)
-
Thomas K. Larson, INEEL
revised / updated 1999 12 22 a zuppero: link
to NearEarth Asteroid section
3 August 97
 |
These are all the known "short period" comets, with period less than
100 years and position within the orbit of Saturn. All (100%) of these
had a tail, at some time, so we were able to see them.
The larger, diamond-dots are the position of the comets on 5 October
1996.
We drew their orbits drawn as equal-time points. This way, the chance
of finding a comet in a given region is approximately proportional to the
density of orbit dots.
We observed a "hole" in the distribution, making a blue "donut," but
don't yet know why it is.
See larger version.
(77 K image) |
Figure 1: Near Earth Comet Map
Invisible without their tails
We believe that the comets dissapear inside the hole because
loose all their water. They become black, completely dry, hydrocarbon rich
objects. Comet Halley is known to be the darkest object in the solar system.
Herded by Mars, Earth, Venus
Dried By the Sun
The images of the orbits and comet positions (and some calculations) suggest
Mars, Earth and Venus herd the dark, dried out comets and keep them inside
the orbit of Mars.
But the Sun fries the water out of any comet that stays closer than
Mars.
Bring Water,
Without ever Bringing A Drop
Some simple analyses suggest that the bone dry hydrocarbon comets bring
water to the Moon and the planet Mercury without bringing a drop. When
they smash into these airless oxide coated objects their speed is very
high compared to the speeds of molecules in a fire or explosion.
Their kinetic energy of their impact with the Moon or Mercury is so
high that each molecule has many times the energy of a molecule in a detonating
explosive (5-20 eV per atom). The temperature can be higher than that of
a plasma torch.
In a blue-hot flash, as short as the flash of a camera (~100 usec or
less), the the hydrocarbons immediately vaporize when the smash into the
moon. Molecules of hydrocarbon become atoms of hydrogen and carbon, just
like in the fireball of a nuclear explosion. Then they smelt the oxides
of the moon or planet dirt (regolith). The raw hydrogen and carbon atoms
reduce the oxides. Just like the Pigmies who made Pig Iron, hot hydrocarbon
atoms rob the oxygen of the dirt, yielding raw iron and the gasses water
vapor and carbon dioxide.
The moon's dirt is 0.3 percent raw iron microflakes.
Water vapor can stay in the lunar vicinity for a year.
Several of the forever-dark crater bottoms at the south pole of the
moon are extremely cold (70 to 100 Kelvins).
Bare water ice in such a crater will not sublime or evaporate away for
the age of the Solar System.
The H2O should condense at the Lunar South Pole. We are still in the
process of observing this.
One Conclusion to Date
The invisible spent comets in the donut hole could be
bringing water to the moon and Mercury.
Data and Facts Leading to Our Conclusions
Puzzle
-
Why does there appear to be a "hole"
just at the orbit of Mars?
-
Why is the distribution so abrupt?
It is steep just at the orbits of Mars and Jupiter.
We plotted the distribution, taking proper account for the individual
periods. Figure 2 shows what appears to be an abrubt change in the probability
of finding a comet. The plot accounts for the difference in individual
periods.
The visual orbit plot is not as accurate as Figure 2. An orbit
in the graphics is the projection of the comet orbit on to the ecliptic
plane. Comet orbits have an inclination average approximately zero, so
the comets ensemble is in the ecliptic plane. They have an average absolute
inclination somewhere between 8 and 12 degres.
The orbital periods are approximately within a factor of two or three
of each other. We used 200 dots per orbit, so the time between dots is
constant for a given comet, but not the same for all.
Radial Density Plot
Figure 2. Radial Density plot. At any given
distance from the sun, the probability of finding a comet whose orbit projects
into a fixed area of about 0.104 square A.U., is 1/200 of the value shown
in the plot.
The area is a radial disc with the Sun as center. At Mars (1.53 A.U.)
the inner boundary of the disc is the semi-major axis value of Mars orbit.
The outher boundary is 1.05 times the Mars orbit.
Shown is the integrated dots per A.U. area, weighted per orbital period.
The result is proportional to the probability of finding a comet whose
orbit projects into a given area in the eclipic plane.
Figure 2 plots the integrated, weighted number of orbit point "dots"
into equal area bins. A dot weight is assigned a value proportional to
the amount of time a comet would have its orbit project into the given
area of the ecliptic plane. This frequency is proportional to the reciprocal
of the orbit period. The reference bin is the area from the orbit of Mars
to 1.05 times the orbit of Mars. This is about 0.1037 square A.U. Each
orbit is calculated with 200 points. So a value of "50" in the figure means
50/200 of an orbit.
The integrated "density of dots" as a function of distance from the
Sun drops by a factor of about 5 just at the boundary of the orbits of
the inner planets Mars, Earth, Venus and Mercury.
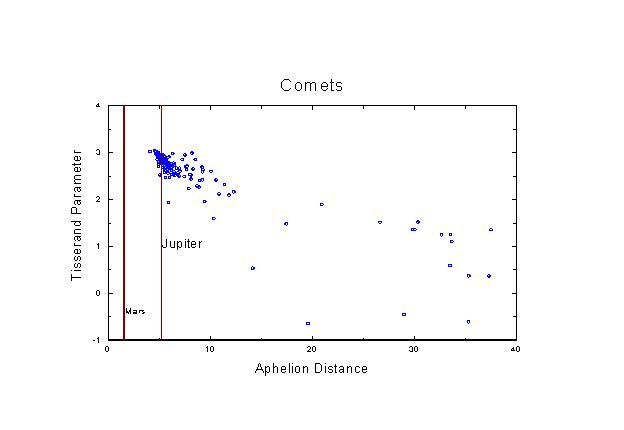
Tisserand Paramter Plot VSPerihelion for Comets
Tisserand Parameter Plot VS Aphelion for
Comets
Whitman EMAIL on Tisserand Plots
John Matese speaks on Tisserand plots
Question: Why is the Periodic Comet Distribution
so abrupt at Mars?
Zuppero says...
email zca@inel.gov or zuppero@srv.net
Whitman says...
comment to pgwhitman@usl.edu
Brian Marsden , Smithsonian Astrophysics
Observatory, says.....
John Matese says (r/e Tisserand plots)
One Evolving Interpretation (summarized by zuppero)
One interpretation is "herding and hiding." Jupiter herds them within its
orbit. We see them because 100 % of them had tails. Then Mars, Earth, Venus
and Mercury herd them, perhaps chaotically, within their orbits, just like
Jupiter. We do not see them when the inner planets herd them because this
close to the Sun (inside 1.5 AU) their water completly evaporates away.
They remain completely dry, and black. They "hide."
Comets are black, as black as chimney soot, so black we can't see them
unless they are as large as near-Earth asteroids. Their albedo becomes
0.03, (or always was, since they are comets) like that of a comet nucleus
with zero coma, zero tail, zero dust emission.
They become fluffy, highly porous, perhaps with a density approaching
that of aerogel (of order 1 to 10 kg per cubic meter), because they loose
their water.
We don't know if fluffy dry comets break easily.
Recent preprint to Whitman by Tremain
suggests most pristine comets break up.
Whitman says about
data of 253 Mathilde
Whitman pointed out that the recent image and data of 253 Mathilde suggest
the carbonaceous asteroids are low density blacker-than-soot objects.
When small, meter sized chunks of dehydrated P/comet hit Earth's atmosphere,
they vaporize with the energy of a 10 ev fireball, above the ozone layer,
so we don't see the intense UV, brief flash.
The kinetic energy of an atmosphere atom or molecule hitting a dry comet
fluff material is of order .63 eV per atomic mass unit. This is the kinetic
energy of material dropped into the potential well of the Earth, which
is about 11 km/sec. An oxygen atom from the atmosphere hits the dry comet
surface with about 10 eV, and a molecule with 20 ev. This is about 10 bond
energies per oxygen.
By comparison, the high explosive Baritol has only .045 eV per amu.
Instead of exploding with a boom, they explode with free radicals. Rich
in hydrogen atoms, the comet mono-atomic fragments combine with atmospheric
oxygen to give the false appearance that they are carrying water.
Rich in Hydrogen, Carbon and Oxygen, in that order
The objects in the Comet Hole, if there are any would be denuded of ice
and consist of material very much like the observed dust grains of comet
P/Halley.
Average atomic abundances
of 17 elements in dust grains
of P/Halley, normalized to Mg = 100
| Element |
Haley dust |
+/- |
| H |
2025.00 |
385.00 |
| C |
815.00 |
165.00 |
| N |
42.00 |
14.00 |
| O |
890.00 |
110.00 |
| Na |
10.00 |
6.00 |
| Mg |
100.00 |
|
| Al |
6.80 |
1.70 |
| Si |
185.00 |
19.00 |
| S |
72.00 |
23.00 |
| K |
0.20 |
0.10 |
| Ca |
6.30 |
1.90 |
| Ti |
0.40 |
0.20 |
| Cr |
0.90 |
0.20 |
| Mn |
0.50 |
0.20 |
| Fe |
52.00 |
9.00 |
| Co |
0.30 |
0.20 |
| Ni |
4.10 |
2.10 |
With many times the per-molecule energy of high explosive, each comet fragment
atom causes many times it's mass of split-oxygen and split nitrogen.
How much synthetically produced ozone has this made? Would this block
UV from emitting to space from the site of the vapor impact.
What happens if a 1 or 5 meter chunk hits the moon?
When a 1 or 3 meter dry comet fragment hits the moon, it is so tenuous
and energetic that the hydrogen and carbon atoms become mono-atomic species
and react with the lunar regolith. The event is more like a the flash of
camera.
The impulse is relatively weak, more like the relatively weak impulse
observed when a powerful (kilo joule per sq. cm) but short (less than 1
microsecond) laser pulse hits the surface of materials. The energy goes
into a few, very fast moving species, and the impulse to the target is
nowhere as much as the same energy deposited into many layers atoms.
The super-hot radicals of C and H steal the oxygen from the regolith
and become CO, CO2 and H2O. The CO and CO2 can not find a place sufficiently
cold to condense and remain condensed on the moon, not even at the lunar
south pole.
The lunar surface should accumulate native, reduced iron flakes as a
result of the highly reducing action of energetic CO and H, as is done
on Earthly steel smelters. The lunar regolith does indeed have 0.3% native
Fe.
The Gibb's Energy Change of "H" atoms strongly favor reducing the oxides
of lunar soil.
Standard State Gibb's Energy Change
(T=1000 K)
negative means reaction is favored
| Oxide |
"H"
Reduction
(kJ/mol O2 |
| FeO |
-287 |
| K2O |
-286 |
| Na2O |
-231 |
| Cr2O3 |
-212 |
| MnO |
-185 |
| SiO2 |
-135 |
| TiO2 |
-120 |
| Al2O3 |
-53 |
| MgO |
-15 |
| CaO |
26 |
From Bullard
The H2O should condense at the Lunar South Pole. We are still in the
process of observing this.
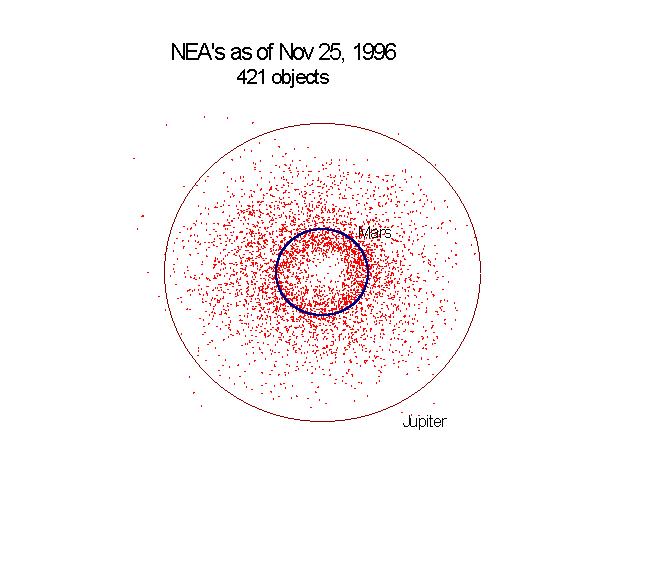
Near Earth Asteroid Population
The near earth asteroids can give a measure of the number of objects within
the inner-planet region, inside the "hole." If the inner planets cause
herding the density of objects ought to be higher than that of the comet
images. Current observation data is insufficient to determine the answer.
The observed data includes objects as small as 8 meters in diameter.
Figure 3: Near
Earth Asteroids as of 5 oct 96 (click here for 38 K hi res image)
(click here for 45 K image of the density function.)
The distribution of 421 known NEA's [as of 6 Oct 1996] appears to display
a strong peak just past Earth's orbit. A clear case of observational bias
is one interpretation of this distribution: we see only those small nea's
that are close enough to see.
Another interpretation is that the distribution is real. Evans
and Tabachnik show that there appear to be stable accumulation regions
just past the orbit of Earth, as in Figure 4,
the NEA distribution, Figure 3, the NEA image space
map, Figure 2, the comet distribution,
and Figure 1, the Near-Earth Comet image space
map. ((click
here for local copy of Evans et. al. for research purposes only))
The
Evans distribution supports this interpretation but does not rule out observational
bias in Figure 3.
The missing mass may indeed be present, but we have not yet looked for
and found enough of it to make inferences.
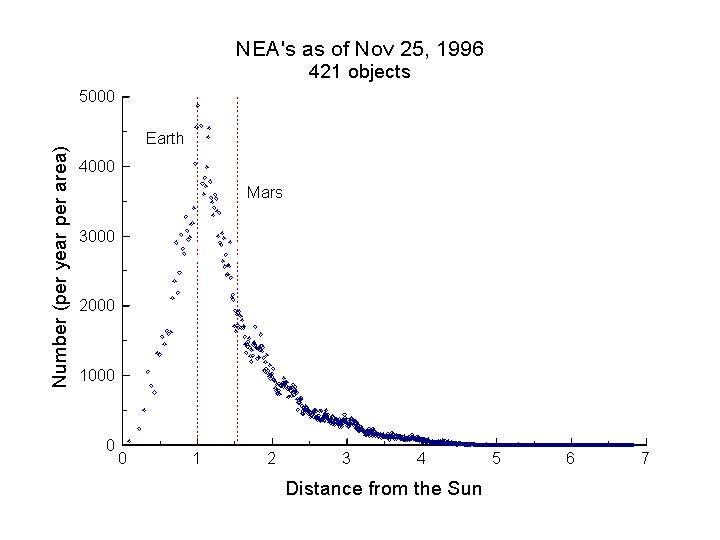
Figure 4: Radial distribution of NEA's.
PLOT: CLICK HERE FOR:
Tisserand Parameter Plot for Near Earth Asteroids
VS Aphelia
Near Earth Asteroid Perihelia may be attached to the earth just as comet
aphelia are attached to Jupiter. A plot of the Tisserand parameter of the
asteroids (SEE PLOT, CLICK HERE) relative to the
earth may provide reason to believe this.
The Tisserand parameter is just a first step in such an association.
Others may have already calculated this, and we have not yet found the
reference.
http://www.nature.com/server-java/Propub/nature/399041A0.figure-1H
COPY of Evans
distribution
Figure 1 The calculated survival time plotted against the starting
semimajor axis (in astronomical units) for test particles in the inner
Solar System. At each semimajor axis, five test particles are launched
at equally spaced longitudes and their initially circular orbits are integrated
for 100 Myr. The times of ejection are marked with filled circles and joined
with solid vertical lines. Test particles close to the terrestrial planets
are rapidly removed. However, between all the terrestrial planets, there
are narrow belts of stable circular orbits that survive for the full duration
of integration of 100 Myr. The semimajor axes of the surviving test particles
are marked by open diamonds at the top of the figure, together with symbols
marking the locations of the four terrestrial planets. (Left to right,
Mercury, Venus, Earth, Mars.) Test particles survive in the following four
regions--between the Sun and Mercury (0.1-0.19 AU),
between Mercury and Venus (0.6-0.66
AU), between Venus
and the Earth (0.79-0.91 AU) and between the Earth
and Mars (1.08-1.28 AU). The two test particles that
remain after 100 Myr at an initial semimajor axis of 1 AU
are actually librating about the Earth's Lagrange points. (These calculations
were performed on personal computers that employ 80 bits internally and
which offer the option of compilation in long double precision with a 64
bit mantissa. At least 64 bits are required to keep Mercury's longitude
error below 0.01 rad over 100-Myr timescales (see ref. 21). Standard double
precision offers a mantissa of just 53 bits.)
Conclusion
The hole is no hole at all. The objects in the "hole" have lost all ability
to possess or show their tail. So they cease to be counted or observed
as comets. They are spent comets, to remain forever dark with albedo of
order 3% or less.
They are mostly pores (fluff, perhaps like aerogel), so their density
is low, possibly of order 1 - 20 kg per cubic meter.
We don't know yet if we should expect them to break apart easily.
We will see no water nor hydroxyl emission from these objects, nor will
we readily see those with sizes below a few tens of meters because they
are so black.
They will not impart much momemtum on impact because their density can
be less than 1% of water. Their per atom energy is so high they favor putting
energy into plasma instead of imparting momentum when they collide with
Earth or the Moon.
References
Huebner, Walter F. (Ed.), "Physics and Chemistry
of Comets," (Astronomy and Physics Library) Springer-Verlag, New York,
1990, ISBN 3-540-51288-4 and ISBN 0-387-51228-4 Springer-Verlag New York,
from chapter by Eberhard Grun and Elmar K Jessberger on "Dust", page
168
Daniel E. Bullard, Peter E. Nolan and David C.
Lynch, "Lunar Oxygen Production in a Hydrogen "Cold" Plasma", pages 1188
thru1198, Volume 2, Engineering and ConstructioN, and Operations in SPACE
IV, proceedings of Space '94, Edited by Rodney G. Galloway and Stanley
Lokaj, American Society of Civil Engineers, 345 East 47th Street, New York,
New York 10017-2398
((N. Wyn Evans and Serge Tabachnik
Nature vol 399, pp 41 - 43 (6 May 1999), "Possible long-lived asteroid
belts in the inner Solar System"))
Work in progress at:


anthony@neofuel.com, zuppero@srv.net, tkl@inel.gov
